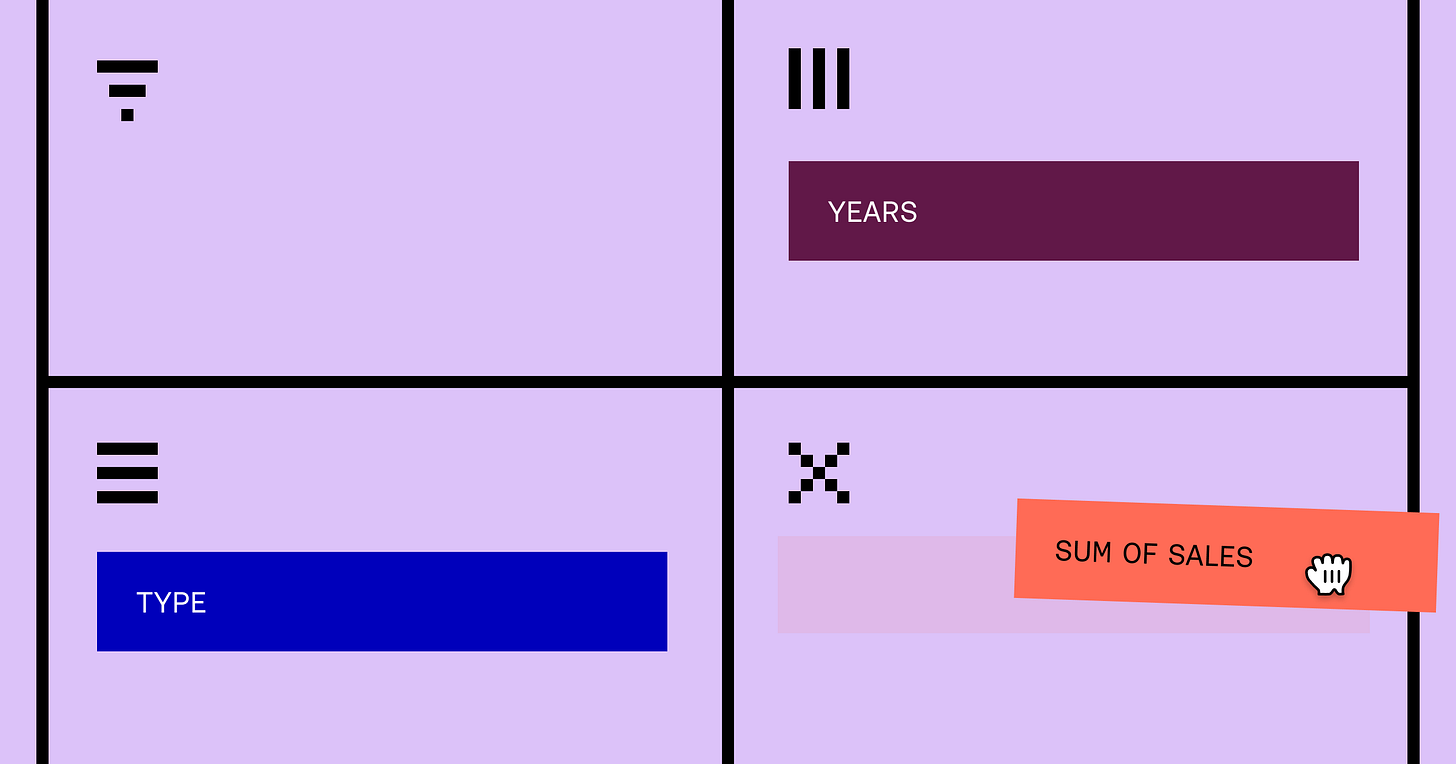
Introducing Pivot Tables for Equals
Today, we launched our most requested feature, pivot tables. To mark it we have a short post on the history of pivot tables. We were surprised by how different they feel when connected to live data.
In 1991, Lotus launched Lotus Improv. Improv was an attempt to improve their popular spreadsheet Lotus 1-2-3 by adding more structure to how data was input and manipulated. Instead of having free-form cells where you could enter data or formulas, these concepts were separated. By adding more structure, your formulas looked like "=Revenue - Costs", and the application would work out how to apply that to the underlying data.
Improv was not a success. Only two versions were ever released, and in 1996, development was officially cancelled. The benefit of adding more structure to a spreadsheet is that you're less likely to make mistakes. But at what cost? Improv's rigidity killed the thing that made spreadsheets so powerful in the first place. As Joel Spolsky, a PM on the early Excel team, said:
Improv assumed that spreadsheets were used for the kind of models made by MBA students ... the real world never fits into n-dimensional hypercubes as well as it did at Wharton.
However, Improv did leave us with one important idea. Because your data in Improv was entered in such a structured form, flipping it around and aggregating in different ways was a natural addition to the product. This functionality was the origin of what today we call a pivot table. Excel realized you could add this functionality on top of your traditional ultra-flexible spreadsheet. And that’s when magic happens. You retain the malleability and playfulness of entering data or formulas anywhere. And you get a whole new layer of manipulation added on top.
I used pivot tables a lot while leading growth at early Intercom. When trying to understand the usage of a new feature or a new funnel, I’d get the data into a CSV, import it into Excel, and fire up a pivot table. While more advanced spreadsheet users might wince at my reliance on the mouse, for me, it was the quickest way to start asking questions of the data.
So, a few months ago, I was pretty excited to try out the first version of pivot tables in Equals. I created a new workbook, pulled in some events from our product metrics SQL database, added a pivot table, and in maybe 10 clicks, start-to-finish was looking at the number of events by user. My reaction – holy shit. By making data a true first-class citizen and eliminating all the menial set-up work, table-stakes features start to take on new life.
It doesn't end there; there are other products that let you quickly query and pivot off your database, but Equals is the only one of those products that is also a full-featured spreadsheet. A pivot in Equals is the start, not the end, of your analysis. And pivot tables can, of course, be used with any data in your Equals workbook. So you can pivot off data directly from your SQL database, SQL data warehouse, Salesforce, or Quickbooks instance.
If you’re a founder or an early growth, operations, or finance leader, we’d love to talk about getting you set up on Equals. There really is no faster way to get insight into your business.


